We know what the spending on internet advertising in Poland looked like in the first quarter of 2022 - IAB Polska released the latest AdEx report (IAB Polska / PwC AdEx)
source: own elaboration
On September 14, IAB Polska published the AdEx report for the first quarter of 2022. Thanks to this, we know what the spending on internet advertising in Poland looked like in the first quarter of this year and what is its growth rate. After almost record results last year (the increase in online advertising spending in 2021 amounted to almost 20% compared to 2020), the first three months of this year are a return to stabilization.
AdEx study
The AdEx survey consists of periodic reports prepared since 2007 by IAB Polska and PwC. Their purpose is to measure online advertising spending in Poland, and the data they contain often form the basis of other analyzes. For the purposes of the study, advertising expenditure includes the budgets of companies allocated to the purchase of advertising space on the Internet, commissions of marketing agencies as well as revenues obtained from the sale of advertising space, and they can be both cash and barter. The data was collected until August 29, 2022 and included the revenues of such entities as: Agora, Burda Media, Cormedia, CS Group (estimated), Dentsu Aegis, Facebook (partially estimated), Freshmail, GK Digitree Group, Google - search engine, contextual advertising, YT, GDN and mobile (partially estimated), GroupM, Allegro Group, Pracuj Group, Wirtualna Polska Group, ZPR Media Group, Havas Media, IDG, IPG Mediabrands, LEADR, Lowe Media, NetSprint, Novem, OLX, OMD, Polsat-Interia , Poland Press Group, Publicis Groupe, Ringier Axel Springer Poland, Communities, Ströer Digital, TVN, TVP. The estimates were based on information from PwC, IHS and Gemius.
AdEx results for the first quarter of 2022
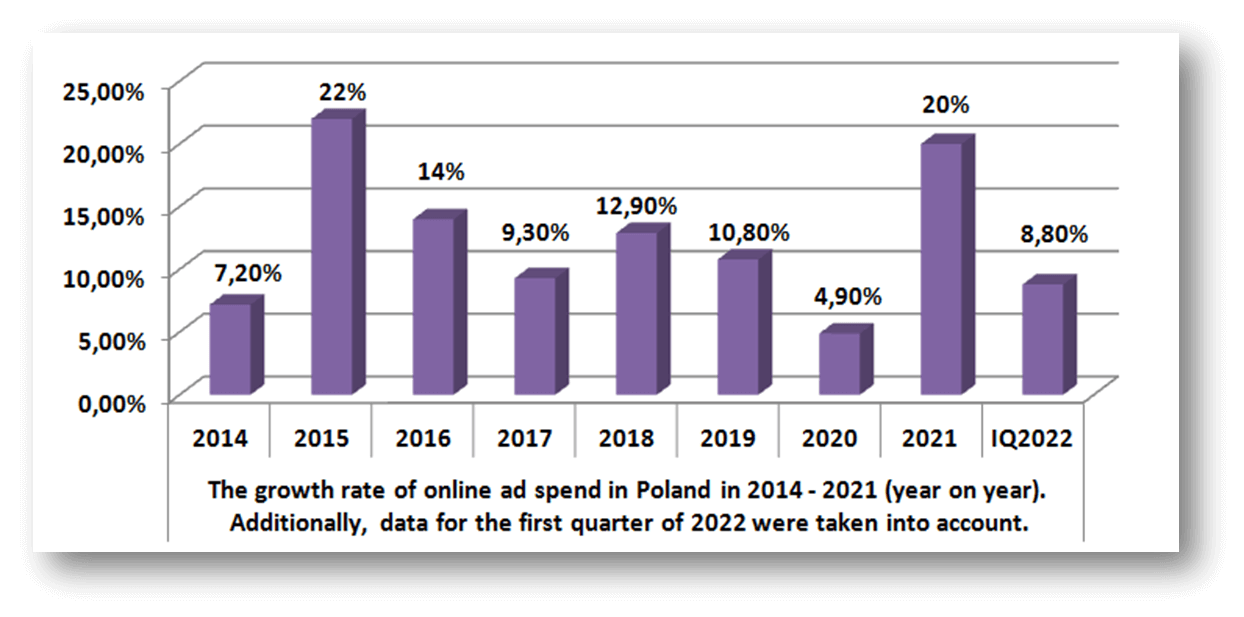
A total of PLN 1.460 billion was spent on online advertising in the first three months of this year, and year-on-year this means an increase of 8.8%. Taking into account the last 8 years, the dynamics of growth in digital ad spend in the first quarter of 2022 is rather average, as shown in the figure below.
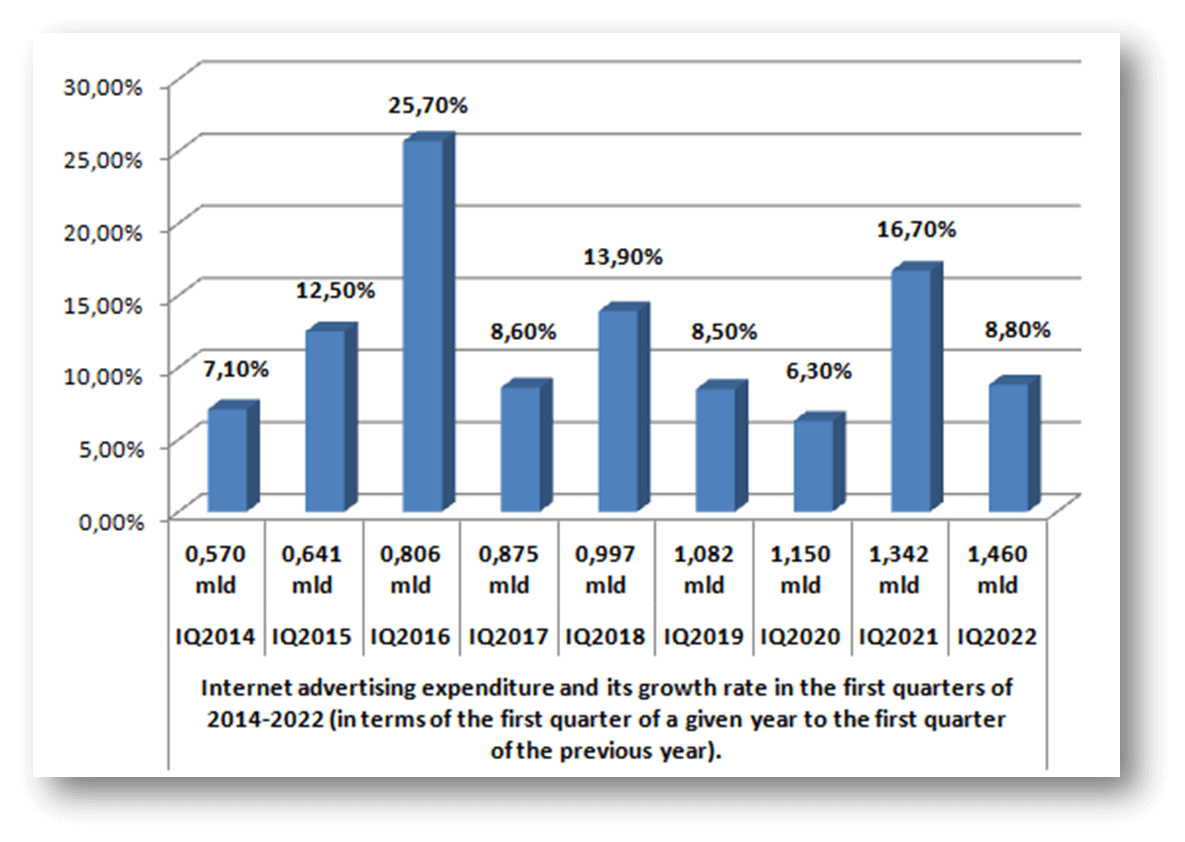
Similarly, if we take into account data from individual quarters. With this approach, the result for the first quarter of 2022 is ideally in the middle - it is better than in the first quarters of 2014, 2017, 2019 and 2020, but worse than in the first quarters of 2015, 2016, 2018 and 2021. The chart below shows how the expenses looked like for internet advertising and their growth rate in the first quarters of 2014-2022. When creating a chart, we took into account the most recent, corrected data from the latest versions of reports.
What forms of advertisements advertisers invest in
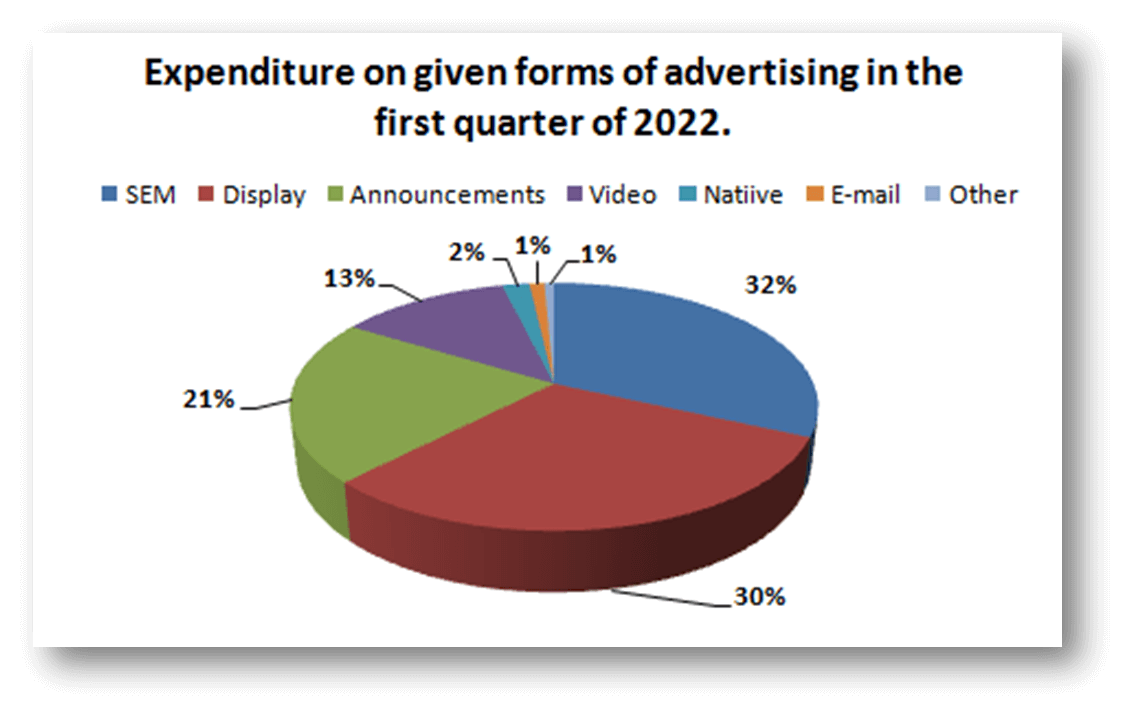
When it comes to specific forms of advertising, still the most funds - almost a third of online marketing budgets (31.8%) is spent on SEM advertising. It also took first place in the first quarter of 2021, but recorded a slight decline year on year - 1.2%. Display ads were in second place with a result of 30.5%. For comparison, in the first quarter of last year it was 32.6%. A total of 21.4% of all online advertising spend was spent on Announcements in the first three months of this year. This is a significant increase year on year - in the first quarter of 2021 it was 17.9%. Subsequently, 12.5% of the funds were allocated to video advertising. This result is similar to the one from the first quarter of 2021 - 12.1%. Native advertising received 2% of online marketing budgets during this period, while advertisers spent 1.1% of funds on marketing emails. These results were almost identical to the same period in the previous year - 2.1% and 1.3%, respectively.
Expenses by industries
When it comes to funds from various industries - one fifth (20%) of all advertising expenditure comes from Commerce, and 11% is accounted for by companies in the Computers and Audio Video category. The third industry that spends the most on online advertising is Telecommunications - 9% of all expenses, followed by Media, Books, CDs and DVDs - 8% and 7% each - Clothing and accessories; Food and Finance. 6% of funds allocated to online marketing each come from companies related to the Automotive Industry and Drinks and Alcohol, and 4% each from the Hygiene and Care and Free Time categories. Companies related to Travel, tourism and HoReCa as well as Pharmaceuticals and medicines are responsible for 3% of all expenditure on digital advertising each. 2% of online marketing spend comes from the Home appliances, furniture and deco and Business services categories, and 1% each from the Real Estate, Household, Chemical and Education industries.
Overall, the results of the report indicate that the dynamics of the growth of internet marketing expenses has stabilized in the first quarter of 2022, despite its huge increase in the previous year (as we have already mentioned, it amounted to 20% for the entire year 2021). Of course, the increase in these expenses, amounting to almost 9%, still means that companies are investing more and more of their funds in online advertising, and there is no indication that this will change in the coming years. Additionally, taking into account the more detailed data, we have to note that neither the overall picture of the market nor the analysis of the expenditure of individual industries shows significant changes on a year-to-year basis. This fact also indicates that the situation has stabilized.
