How has the online advertising market changed in Poland in years 2014-2021? Analysis based on IAB Polska / PwC AdEx reports

source: own elaboration
According to IAB Polska / PwC AdEx reports, the internet advertising market in Poland in 2021 gained 20% in value compared to the previous year and was worth as much as PLN 6.237 billion. This is obviously a huge increase, but it is even more shocking if we take into account that in 2014 advertisers spent PLN 2.6 billion on online advertising in Poland, so within 8 years this market not only doubled its value - it grew as much as by 139%! How exactly were the changes in internet marketing spending in our country from 2014 to 2021? We will discuss it in the following text, based on data from IAB Polska / PwC AdEx reports.
How are IAB Polska / PwC AdEx reports prepared?
The above-mentioned studies are usually carried out for each quarter of a given year and are based on financial data obtained directly from publishers (owners of advertising space) and entities intermediating in its sale (advertising networks, affiliate networks, media houses, etc.). Thus, the study doesn’t concern the advertising space itself, but its value calculated on the basis of purchase or sales invoices, and the discounts granted are also taken into account. The scope of the report, however, doesn’t include additional costs incurred by advertisers, such as: creating a creative, developing a strategy, acquiring data, running a fan page, SMS / MMS communication, etc.
Just like the online advertising market itself, the survey developed over the past 8 years - in 2016, the group of report participants was expanded, the estimates for YouTube and Facebook were refined, and the scope of the report was expanded to include programmatic analyzes. Since 2018, data for the report was collected in two ways, using an appropriately modified original form and a new tool with a slightly different structure. From the first quarter of 2020, the report is prepared only with the use of new forms, but the overlap of the methodology in the 2018-2020 period allowed for the historical comparability of the results. In a few cases, the introduced changes had an impact on the result in a given year - when writing this article, we relied on the latest data, i.e. after any modifications.
How has the value of the online advertising market in Poland grown since 2014?
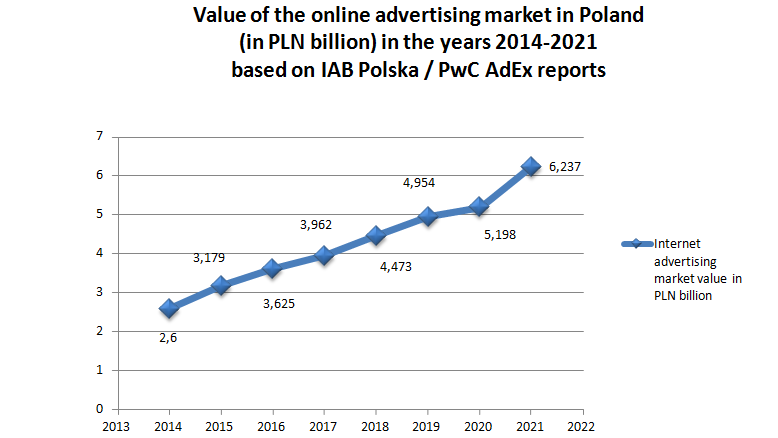
According to the IAB Polska / PwC AdEx report for 2014, advertisers spent PLN 2.6 billion on online advertising (including display, SEM, advertisements, video, e-mail and others). The year-on-year increase in value was then 7.2% (the value of the online advertising market in Poland amounted to PLN 2.432 billion in 2013). A year later, in 2015, we are talking about PLN 3.179 billion. It was the largest increase in online advertising spending in the analyzed period, amounting to as much as 22% year on year. The result from 2016 was also impressive (although not as much) - a 14% increase in the value of the online advertising market from 3.179 to 3.625 PLN billion. In 2017, it was valued at PLN 3.962 billion, which meant an increase by „only” 9.3%. The PLN 4 billion threshold was exceeded a year later, in 2018. This year, advertisers spent PLN 4.473 billion on online advertising, which was 12.9% more than in the previous year. In 2019, the result was almost PLN 5 billion. Almost, because finally the data for the whole year showed PLN 4.954 billion, with a year-on-year increase of 10.8%. Interestingly, the lowest pace of value growth in this period was recorded in the online advertising market in 2020. Advertisers then allocated PLN 5.198 billion to this marketing channel, i.e. only PLN 244 million (or 4.9%) more than in 2019. Such a result may be surprising, especially that this year was marked by the covid 19 coronavirus pandemic, when many businesses have moved to the internet out of necessity. However, the pace of growth didn’t slow down for long - the past year 2021 was almost a record increase in the value of online advertising - PLN 6.237 billion and year-on-year growth by almost 20%.
source: based on IAB Polska/PwC AdEx reports
On which channels advertisers spent the most in particular years in the analyzed period?
In 2014, the largest expenditure on online advertising was spent on the Display channel - 37% of all expenses and SEM (Search Engine Marketing) - 36.5%, then 13.9% of the investment was allocated to Announcements, Video advertising 7.5% and Email marketing 4.6%. The situation was very similar a year later, in 2015 - an increase was recorded by Display advertising - by 4% to 41% of all expenses, and Video - by 0.5% to 8%, while expenses in other channels slightly decreased - SEM by 2%, Announcements by 1%, and E-mail by less than 2%. Not much has changed also in 2016 - a slight increase was observed in the Display and Video channels, while a slight decrease - in SEM. However, the distribution of internet marketing expenses in 2017 was slightly different. The first place and 37% of all investments in online marketing still belonged to Display advertising, and the second place with 33% of expenses for SEM. Video advertising was placed with the result of 13%, and it has been growing in strength for several years. On the other hand, e-mail marketing was losing its importance with a result of 3%. These trends were also visible in 2018 - the Video ad and Announcements strengthened their position, taking 15% of all online marketing expenses each. E-mail advertising investment fell to 2%, while the leading Display and SEM channels saw declines (in terms of share of total spend) - to 35% and 32% respectively. The situation was very similar in 2019. A year later, in 2020, native advertising was included in the report for the first time. It received 2% of all online marketing expenses. Marketing in search results for the first time in a given period took first place, with a result of almost 35% of all investments. Display advertising came in second place, spending on it in 2020 accounted for 32% of all online marketing. 15% were Announcements, less than 14% - Video advertising, and less than 2% e-mail marketing. What was the situation like in 2021? Display advertising was back on the podium, accounting for over 32% of all online marketing spending. Of course, it was followed by the SEM advertisement, for which less than 1% less funds were allocated (31%). Announcements were a hit, for which in 2021 as much as 17% of all funds allocated to online marketing were spent, almost unchanged - 14% of them were in the share of Video advertising, and a slight increase - almost 2.5% was recorded by native advertising. Email marketing has declined in importance again - accounting for just over 1% of all online advertising investment.
It is very important to analyze the changes that are taking place year after year on the Polish internet marketing market. Thanks to this, we know, above all, in which directions advertisers and publishers are going, but also other entities intermediating in internet marketing. We can also see how quickly we are adapting to changes taking place in the world, including events such as the 2019 coronavirus pandemic. What results will 2022 bring? Will we keep the growth rate of the value of the online advertising market at 20%, or will we see a decline in its value for the first time in many years? We are waiting for the results of the IAB Polska / PwC AdEx report, and those for the first quarter of this year should appear soon.


